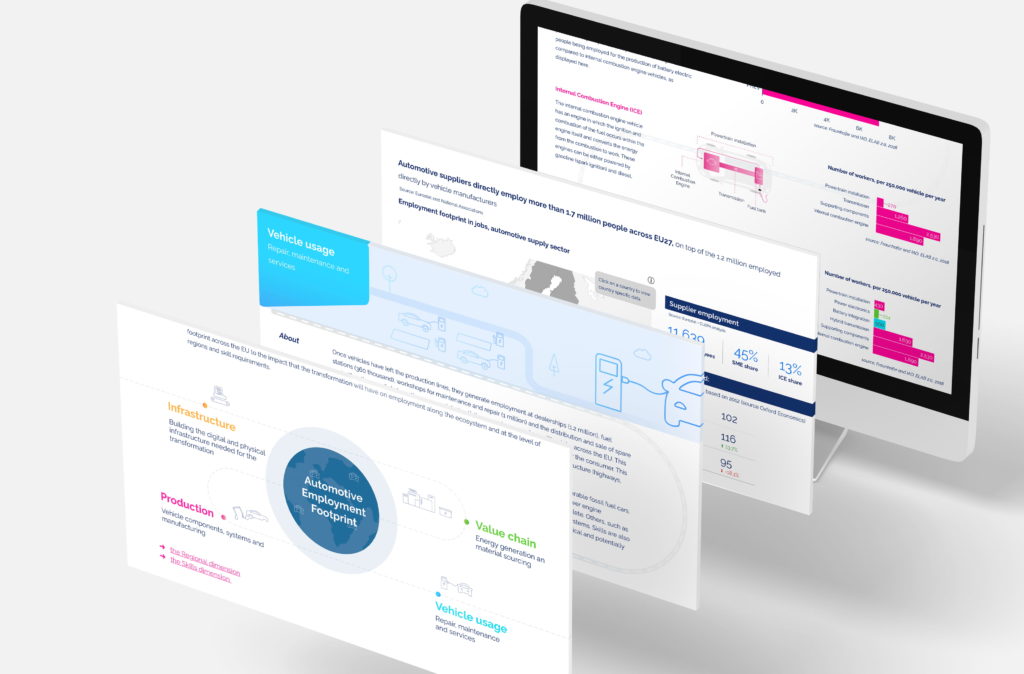
Data centralization & visualization for Vacature
Vacature.com/Références.be is one of the largest online job platforms in Belgium. Since 1996 they assist people with their professional careers and point them in the right direction when looking for a new challenge. They offer a wide variety of information on their website, such as job search tips, information on benefits, vacation and dismission, as well as templates you can use to enhance your curriculum vitae.
The goal
The goal was to establish a standardized report that reflected specific insights for the marketing team as well as for the management team.
This gave us the following requirements:
- Insight in the overall performance, both high level and at traffic source level;
- Detailed insights in the performance of the key KPI’s;
- Integration of data from non-google services (from paid channels and the backend);
- Quick and easy data collection without data sampling so that reports can be delivered quickly;
- Recording of historical data for the setting of benchmarks, trend lines and other comparisons.
What we did
Approach
Although there are several dashboarding tools available on the market, we decided to go with Klipfolio. Klipfolio offers a lot of freedom and flexibility toward data manipulation and has plenty of options when it comes to visualization. For the collection of data, we used a Google Analytics API, Google spreadsheets and other 3rd party integrations such as Selligent and social media integrations.
This allowed us to collect all the necessary data easily and to isolate big chunks of this data without sampling. Klipfolio made it easy to link external data and combine all these different sources into one comprehensive KPI dashboard.
The results
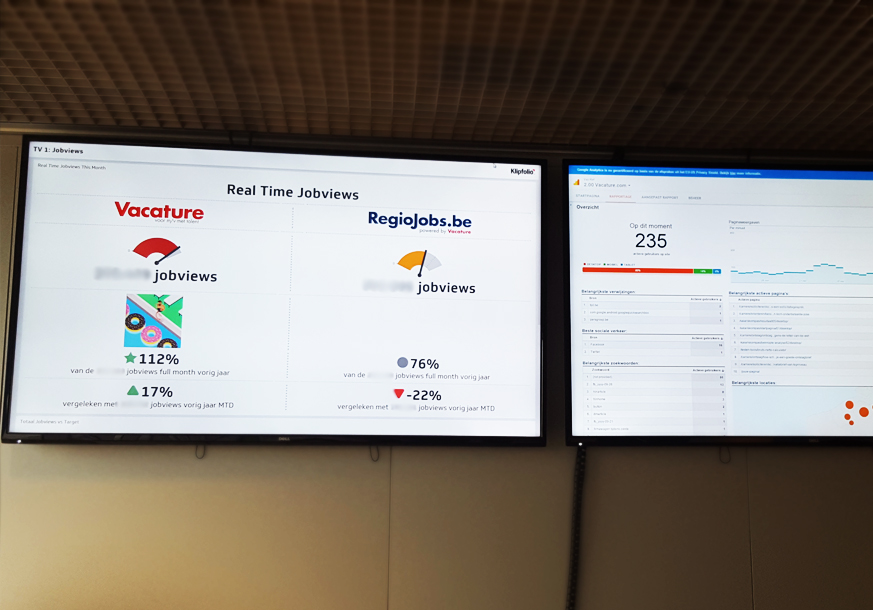
This resulted in a wide variety of dashboards which are being displayed on big HD monitors in the Vacature headquarters. This keeps all stakeholders up-to-date with latest targets and real-time statistics. Next to the KPI dashboards we also developed a monthly report dashboard, which allows management to compare month-to-month statistics and gives an instant impression of possible pain-points (e.g. underperforming traffic sources).
B2C, B2B and content teams each have their individual KPI dashboards. To give an example, the content dashboard lists all the top performing articles and vacancies in a certain period of time. With Facebook integration they can also see what articles are most shared, interacted with and have the best click-through rate.
Next steps
The dashboards are designed in a way that the data is sorted automatically. This way no additional maintenance is necessary. unless new campaigns are added, URLs are changed or when a migration takes place. The client has easy access to the overall performance of the platform and the performance of all campaigns.